This is an overview of geographical cash access coverage in the UK at the end of the fourth quarter (October to December) of 2022. This monitoring forms part of the FCA’s work on access to cash.
1. Introduction
On a quarterly basis, with the Payment Systems Regulator (PSR), we gather and update data on access to cash. This captures the locations of cash access points and other relevant information like temporary closures, opening hours, and accessibility. This data covers brick-and-mortar, mobile bank, and building society branches, automated teller machines (ATMs), and the Post Office network. We supplement this information with annual data on cashback locations.
This analysis provides insights on the proportion of the population that lives within a range of distances of various cash access points. We measure distances as the crow flies (see note 1) relative to residential addresses (see note 2).
1. Relative to analogous travel distance, the approach based on straight line distances is likely to overestimate coverage and underestimate the areas with no coverage. The effect is likely to be more important for longer, non-walkable distances. All computations are performed in the British National Grid (OSGB 1936) projection.
2. Our current approach measures straight line distances from residential addresses to their nearest access point by type. To determine aggregate coverage percentages we estimate the total number of residential properties within a set distance of an access point at a certain geographical level eg Output Area, Local Authority District, Country etc. Due to a change in methodology effective from the 2022 Q1 analysis it is not possible to directly compare coverage analysis for this or future quarters with analysis for 2021. Based on testing between methodologies undertaken using 2021 Q4 data we do not believe conclusions based on key headline figures are significantly affected by the choice of methodology.
Previously our summary focused on coverage within 2km and 5km of a cash access point. Starting this quarter our primary measurements of coverage will focus on deposit and withdrawal facilities in urban areas at 1 mile and rural areas at 3 miles. This aligns with HMT’s policy statement description of access.
We estimate that for access to larger banks and building societies providing Personal Current accounts (PCA) and Post Office: all branches, including mobile bank branches:
- 97.4% of the UK urban population are currently within 1 mile of a free-to-use cash access point offering deposits
- 98.3% of the UK rural population are currently within 3 miles of a free-to-use cash access point offering deposits
We estimate that for access to any bank, building society, Post Office branch, or any free ATM:
- 99.3% of the UK urban population are currently within 1 mile of a free-to-use cash access point offering withdrawals
- 98.7% of the UK rural population are currently within 3 miles of a free-to-use cash access point offering withdrawals
For the UK as a whole, estimates of coverage at 1 mile and 3 miles have seen little change since 2022 Q2. However, there have been changes in the type of access point available over this time. Between 2022 Q2 and 2022 Q4:
- The number of brick-and-mortar branches of the larger banks and building societies providing PCAs fell by 429 branches, a decrease of 8.6%.
- There was a 4.1% decrease in the number of free-to-use ATMs while the number of pay-to-use ATMs dropped by 6.3%. Due to the timing of the receipt of the source data, this shows the change over a period of 10 months.
- The number of post offices was stable.
Our analysis of other access characteristics finds that during this period:
- The cumulative weekly opening hours of smaller banks and building societies has reduced by almost one hour since 2022 Q2.
- There was a small increase (1%) in the number of larger banks and building societies (type A) opening on weekdays between 9am and 3pm but a larger reduction (6-8%) opening between 3pm and 4.30pm. This reduction was driven by opening hour changes by two large PCA providers.
- There was a decrease of 1-2% of smaller banks and building societies (type B) opening on weekdays between 10am and 2pm. For earlier morning and mid-afternoon (9-10am, 3-4:30pm) the reduction was 4-5%.
- Temporary closures of type A (brick-and-mortar branches of a larger PCA provider) showed an increase from 2022 Q2 [see note 11], putting it back to the level of 2022 Q1. We cannot get reliable results for type B (smaller branches) due to a high proportion of branches not returning data
2. Coverage
The data comprises 67,435 known UK cash access points and 487,359 cashback locations. Table 1 shows numbers by region for 8 types of access point (see notes 3, 4, and 5):
- Types A and B are brick-and-mortar bank and building society branches provided by (A) larger PCA providers and (B) all other banks and building societies, respectively.
Type B branches may offer more limited deposit and withdrawal services compared to type A branches, for example, a building society that specialises in mortgages or savings accounts. - Mobile bank branches (measured by stops) are a separate type (D).
- Post Office branches are subdivided into mobile / outreach branches (type E) and all other Post Office branches (type C). The outreach branches are brick-and-mortar but are more similar to mobile branches being typically open for a small number of hours or on selected days of the week. For example, these include limited time to serve access points in community buildings in rural locations. For this reason, we group the mobile and outreach branches together.
- ATMs are subdivided into free-to-use (type F) and pay-to-use (type G).
- Cashback locations (type H) are all the unique locations where a cashback transaction took place in 2022.
| Country / Region | England | Northern Ireland | Scotland | Wales | UK Total | |||||||||
|---|---|---|---|---|---|---|---|---|---|---|---|---|---|---|
| Type | Description | East Midlands | East of England | London | North East | North West | South East | South West | West Midlands | Yorkshire and The Humber | ||||
| A | Larger banks and building societies providing PCA (brick-and-mortar branches) | 281 | 422 | 622 | 170 | 453 | 656 | 401 | 380 | 317 | 140 | 461 | 262 | 4,565 |
| B | All other banks and building societies (brick-and-mortar branches) | 99 | 69 | 53 | 49 | 94 | 68 | 76 | 126 | 100 | 31 | 36 | 105 | 906 |
| C | Post Office branches excluding mobile/ outreach | 732 | 984 | 702 | 403 | 965 | 1,250 | 989 | 806 | 815 | 465 | 1,061 | 696 | 9,868 |
| D | Mobile bank branches | 24 | 22 | 5 | 27 | 59 | 95 | 10 | 10 | 13 | 416 | 96 | 777 | |
| E | Mobile/ outreach Post Office branches | 147 | 189 | 95 | 151 | 141 | 266 | 113 | 151 | 29 | 262 | 262 | 1,806 | |
| F | Free-to-use ATMs | 2,712 | 3,229 | 5,179 | 1,720 | 4,288 | 4,745 | 2,944 | 3,395 | 3,334 | 1,417 | 3,903 | 1,860 | 38,726 |
| G | Pay-to-use ATMs | 648 | 850 | 1,668 | 529 | 1,465 | 1,091 | 683 | 1,176 | 781 | 325 | 978 | 593 | 10,787 |
| H | Cashback locations | 33,855 | 43,574 | 67,676 | 17,367 | 53,518 | 69,169 | 46,558 | 36,788 | 39,142 | 13,959 | 42,583 | 23,170 | 487,359 |
| All sources excluding cashback | 4,643 | 5,765 | 8,224 | 2,971 | 7,443 | 8,010 | 5,454 | 6,006 | 5,508 | 2,420 | 7,117 | 3,874 | 67,435 | |
| All sources including cashback | 38,498 | 49,339 | 75,900 | 20,338 | 60,961 | 77,179 | 52,012 | 42,794 | 44,650 | 16,379 | 49,700 | 27,044 | 554,794 | |
Table 1: Number of cash access points by type and region (.xlsx)
3. The counts in Table 1 are for all known access points. The number of unique locations offering access will be smaller because, for example, a typical branch will have one or more internal and/or one or more external ATMs, and these are counted separately. This does not apply to cashback vendor locations as only unique locations are counted (see also note 4). There are no mobile bank branches or mobile/ outreach Post Office branches in London.
4. Cashback locations are the unique locations of vendors which are known to have offered cashback at some point in 2022 to customers using either a Mastercard or a Visa card. There could be other merchants offering cashback not included in this dataset, either because no transaction involving cashback took place or because such transactions did not involve Visa or Mastercard.
5. While we have made every effort to ensure the dataset is complete and up to date, there may still be some omissions or other discrepancies. This dataset does not include ATMs that were temporarily closed at the time the data was collected. Data on some smaller banking companies may be missing, and not all recent branch closures, openings or other changes may have been reflected. Where a bank or building society has not provided data, we have used submissions from previous quarters. Of the Post Office branches, we included only those classified by the Post Office as active at the time the data was collected.
We have analysed coverage for 14 groups of cash access points which we define in Table 2. The groups are constructed by combining the cash access point types and cashback locations:
- group 1 includes type A (larger banks and building societies providing PCA) access points only
- group 2 adds the non-mobile/outreach Post Office network
- group 3 includes all brick-and-mortar (except type B) and mobile/outreach bank, building society, and Post Office branches, representing all known locations where customers can access banking services beyond cash withdrawals or deposits
- groups 4 and 5 include the same cash access point types as Group 3, as well as all free-to-use ATMs and all ATMs respectively
- group 6 includes type B branches and contains all free-to-use access points.
- group 7 includes all 67,435 known cash access points
- groups 8 and 9 focus on access to ATMs, for free-to-use and all ATMs respectively
- groups 10, 11, and 12 combine free-to-use access points, all access points and all ATMs respectively with cashback locations
- groups 13 and 14 focus on access to the Post Office network distinguishing between non-mobile/outreach branches and all branches
Due to substitutability, as outlined above, type B branches are only included in groups 6, 7, 10, and 11.
Table 2: Groupings of cash access points
| Group | Description | Cash access point types included | Number of entities | |||||||
|---|---|---|---|---|---|---|---|---|---|---|
| A | B | C | D | E | F | G | H | |||
| 1 | Larger banks and building societies providing PCA: brick-and-mortar branches | x | 4,565 | |||||||
| 2 | Larger banks and building societies providing PCA and Post Office: brick-and-mortar branches | x | x | 14,433 | ||||||
| 3 | Larger banks and building societies providing PCA, and Post Office: all branches, including mobile | x | x | x | x | 17,016 | ||||
| 4 | Post Office, larger banks and building societies providing PCA (all branches), and free-to-use ATMs | x | x | x | x | x | 55,742 | |||
| 5 | Post Office, larger banks and building societies providing PCA (all branches), and all ATMs | x | x | x | x | x | x | 66,529 | ||
| 6 | All free-to-use cash access points (excluding cashback) | x | x | x | x | x | x | 56,648 | ||
| 7 | All cash access points (excluding cashback) | x | x | x | x | x | x | x | 67,435 | |
| 8 | Free-to-use ATMs | x | 38,726 | |||||||
| 9 | All ATMs | x | x | 49,513 | ||||||
| 10 | All free-to-use cash access points and cashback locations | x | x | x | x | x | x | x | 544,007 | |
| 11 | All cash access points and cashback locations | x | x | x | x | x | x | x | x | 554,794 |
| 12 | All ATMs and cashback locations | x | x | x | 536,872 | |||||
| 13 | Post Office branches excluding outreach and mobile | x | 9,868 | |||||||
| 14 | All Post Office branches | x | x | 11,674 | ||||||
On this web page we provide highlights of coverage in Table 3. We present data for groups 3 and 6 as proxies for cash deposit and free cash withdrawal access for consumers. We provide these figures for Great Britain, Northern Ireland and the UK as a whole split by overall, rural and urban at distances of 1 mile and 3 miles.
Larger banks and building societies providing PCA and Post Office: all branches, including mobile
| Region | Rural / Urban | Population, 000's | ||||
|---|---|---|---|---|---|---|
| 2km | 5km | 1mi | 3mi | |||
| UK | Overall | 67,071.90 | 95.1 | 99.7 | 92.7 | 99.7 |
| Rural | 12,046.50 | 77.2 | 98.6 | 71 | 98.3 | |
| Urban | 55,025.40 | 99 | 99.9 | 97.4 | 99.9 | |
| GB | Overall | 65,176.40 | 95.4 | 99.7 | 93 | 99.7 |
| Rural | 11,337.20 | 78.4 | 98.7 | 72.2 | 98.5 | |
| Urban | 53,839.20 | 99 | 99.9 | 97.4 | 99.9 | |
| NI | Overall | 1,895.50 | 84 | 98.7 | 79.8 | 98.4 |
| Rural | 709.3 | 59.1 | 96.4 | 51.9 | 95.7 | |
| Urban | 1,186.20 | 98.8 | 100 | 96.5 | 100 |
Group 6: All free-to-use cash access points (excluding cashback)
| Region | Rural / Urban | Population, 000's | ||||
|---|---|---|---|---|---|---|
| 2km | 5km | 1mi | 3mi | |||
| UK | Overall | 67,071.90 | 96.3 | 99.8 | 95.1 | 99.7 |
| Rural | 12,046.50 | 81.4 | 98.9 | 75.8 | 98.7 | |
| Urban | 55,025.40 | 99.6 | 100 | 99.3 | 100 | |
| GB | Overall | 65,176.40 | 96.6 | 99.8 | 95.4 | 99.7 |
| Rural | 11,337.20 | 82.4 | 98.9 | 77 | 98.8 | |
| Urban | 53,839.20 | 99.6 | 100 | 99.3 | 100 | |
| NI | Overall | 1,895.50 | 86.4 | 99.2 | 83.3 | 99 |
| Rural | 709.3 | 64.2 | 97.8 | 56.6 | 97.3 | |
| Urban | 1,186.20 | 99.7 | 100 | 99.2 | 100 |
Estimated percentages of the UK population living within a given distance from a cash access point for all groups 1-14 (see notes 6, 7, and 8).
We give the estimates for the UK regions and devolved nations separately, as well as for England and the UK overall. Estimates for rural and urban areas are also given (see note 9).
The distances considered are 1, 2, 3, 5, and 10 miles (approximately 1.6, 3.2, 4.8, and 16 km, respectively).
UK population living within a given distance from a cash access point for all groups 1-14
6. All population estimates are based on 2011 census output area (OA) geographies (small areas in Northern Ireland), mid-2020 estimates of the usual resident population for OAs in England, Northern Ireland and Wales, and for Data Zones in Scotland. We obtained population estimates for OAs in Scotland by proportionally adjusting the 2011 census estimates using the aggregate mid-2021 population estimates for Data Zones. We compute the population estimates for arbitrary areas based on the assumption that population density is uniform over each OA. For ease of reference, columns ‘Population, 000’s’ in Table 3 reproduce these population estimates (in thousands) for all included areas.
7. While we have made every effort to get precise locations of all access points, some locations are precise to their respective postcode centroids only. In most cases the locations used in this analysis are those supplied by banks, building societies, the Post Office, the LINK Scheme Ltd, Visa, and Mastercard.
8. All estimates in Table 3 are reported to 1 decimal place precision. For some groups the estimates are very similar or nearly identical, for example those for groups 7 (all cash access points) and 5 (all except type B). This is because many cash access points, particularly bank and building society branches, tend to cluster around settlement centres.
9. The definitions used for rural-urban classification differ between England and Wales, Scotland and Northern Ireland. In the case of Northern Ireland, for simplicity, we have reallocated the 165 out of 4,537 small areas originally assigned to a mixed rural/urban category to either rural or urban category based on their band. We have allocated bands A-E as urban and F-H as rural; see NISRA Urban-Rural Classification 2015 for more details.
Figure 1: Access to cash coverage in the UK in 2023 Q1
3. Other insights
3.1. Temporary closures
We cannot give precise figures for temporary closures because a high proportion of branches did not provide this information. But there has been an increase in the overall number of days closed across type A (large PCA providers) since 2022 Q2, putting it back to the level of 2022 Q1. Of type A branches that did provide this information (87%) there were 16.4% that were temporarily closed for at least one day, which is an increase on 2022 Q2 (13.1%).
We do not have equivalent information for Post Office branches.
3.2. Opening hours
While external and stand-alone ATMs are always accessible, in-branch cash withdrawals and deposits and other banking services are only available during branch opening hours.
Figure 2 shows the percentages of branches open at a given time between 7am and 7pm, Monday to Saturday (see note 10), by branch types defined in Table 1.
Figure 2: Percentages of branches open at a given time by branch type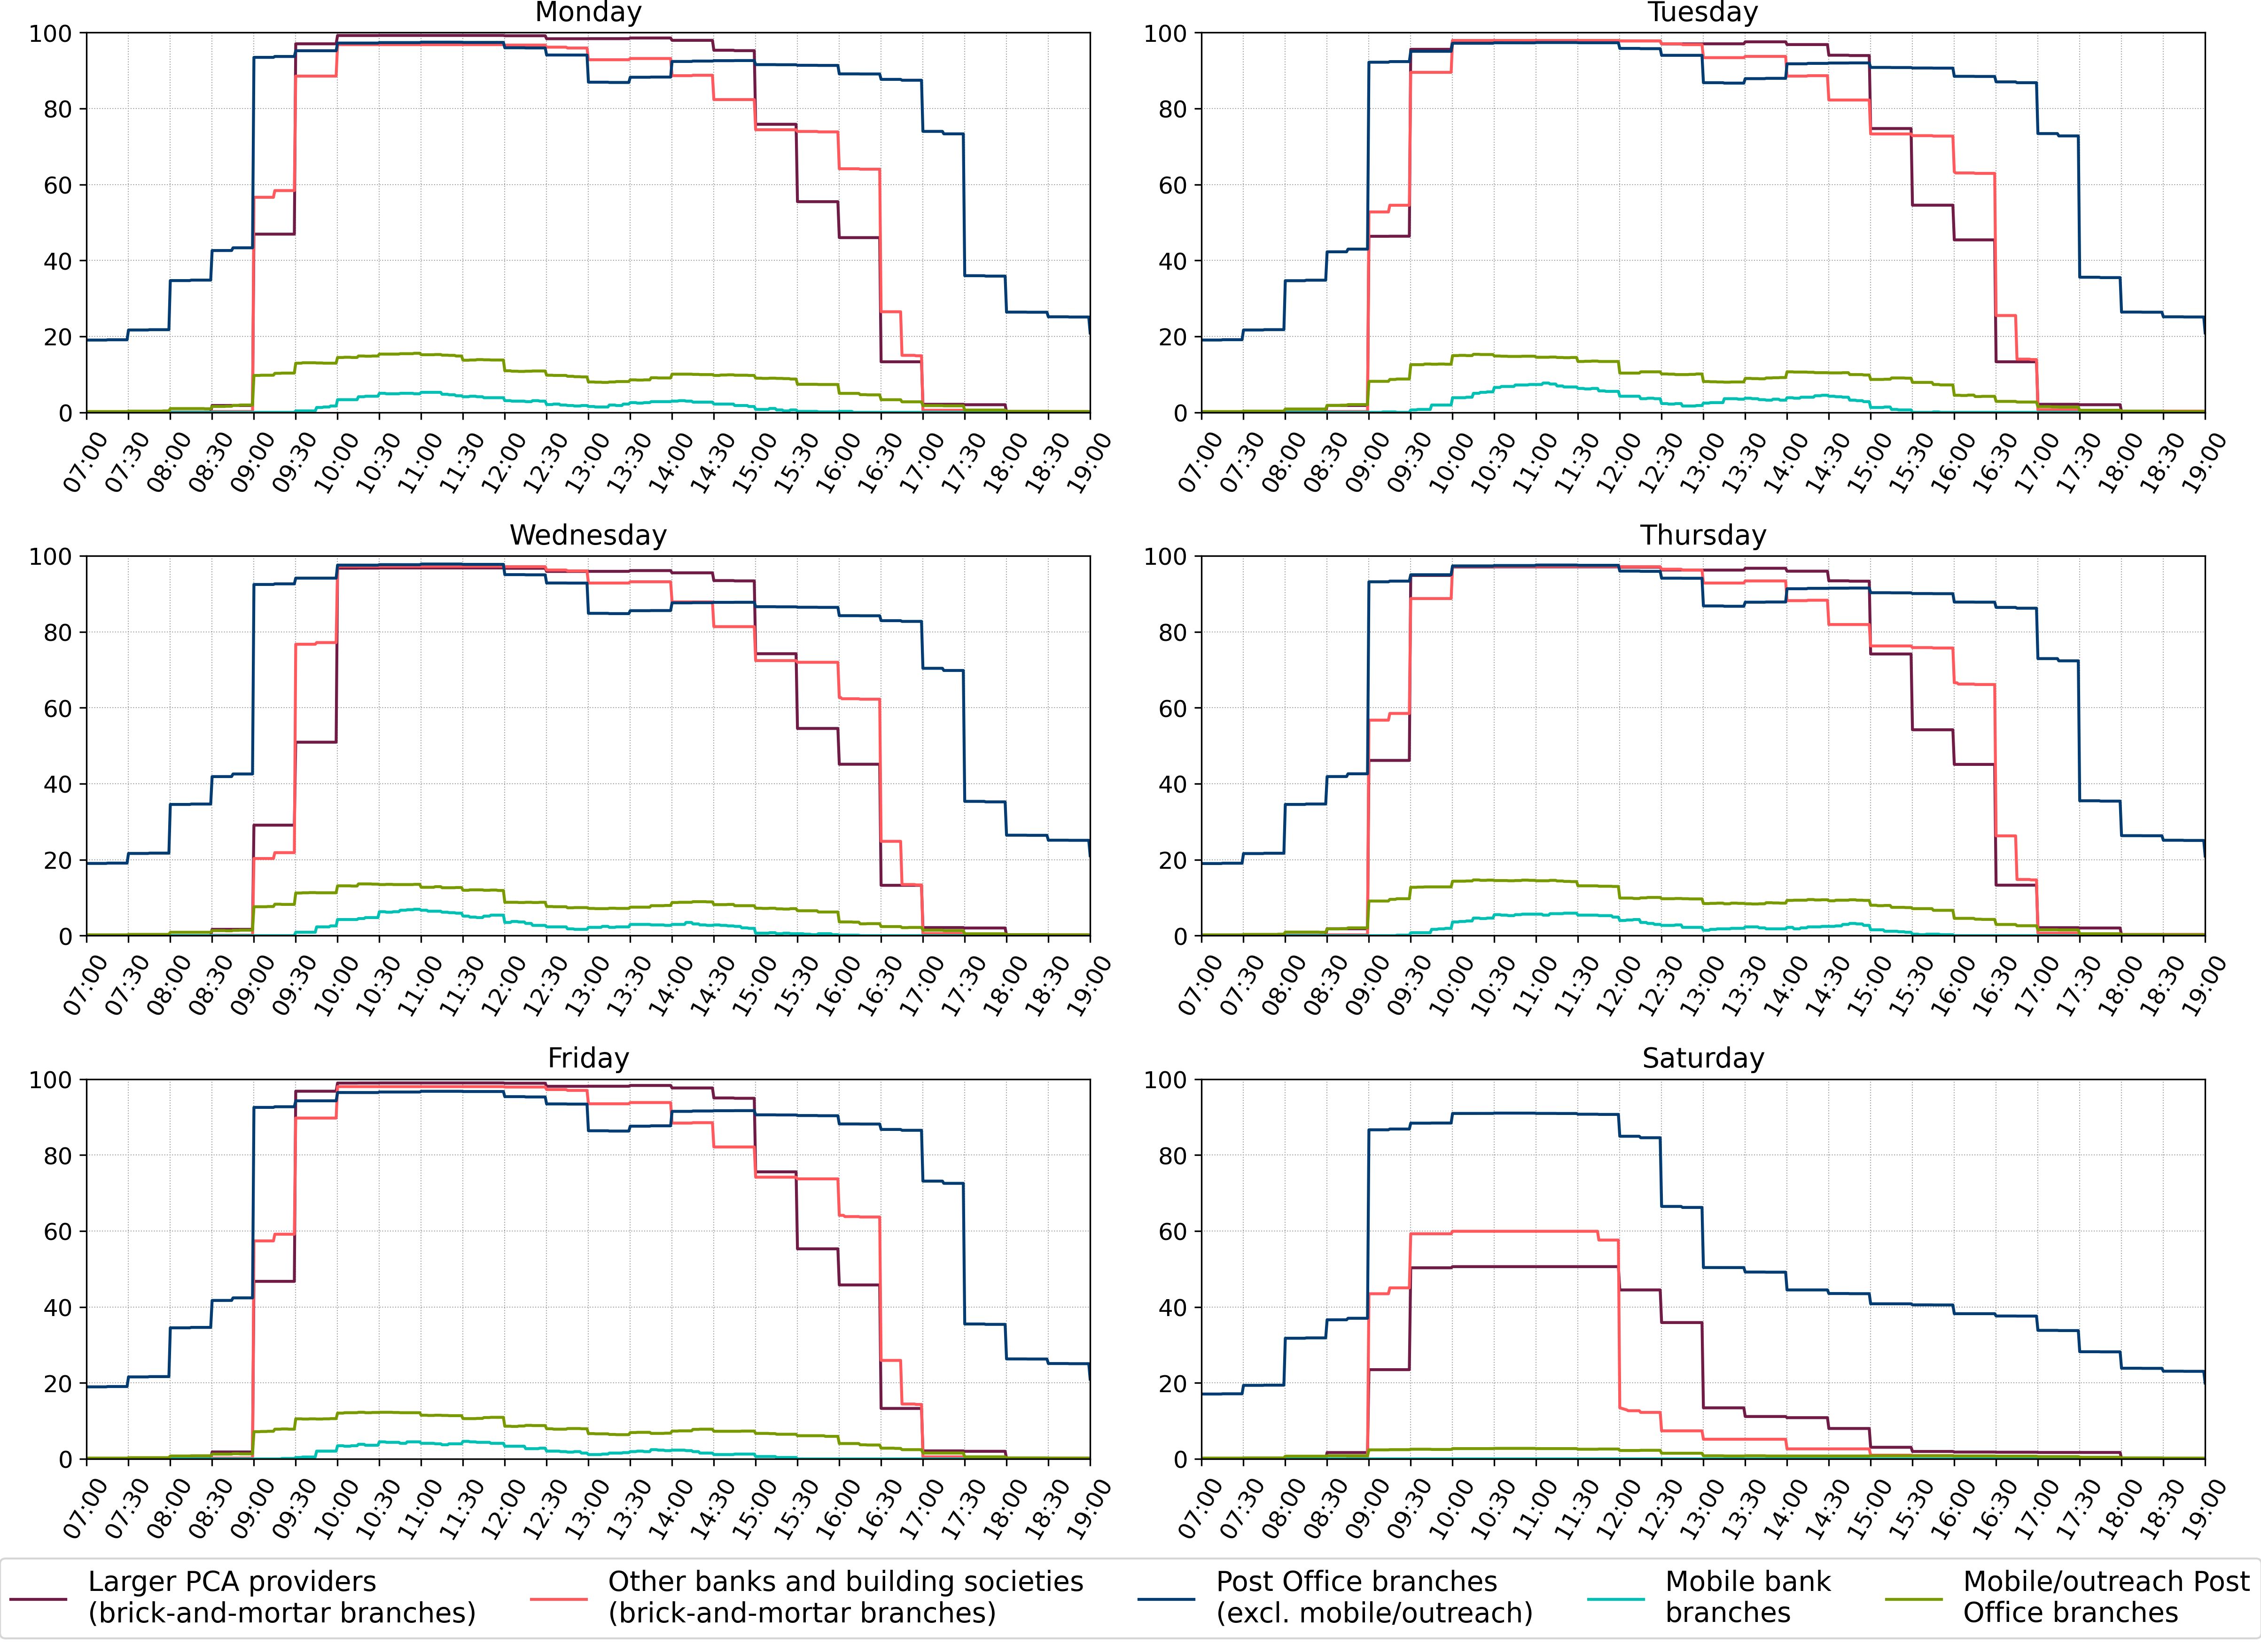
Figure 2: Percentages of branches open at a given time by branch type (.pdf)
3.3. Accessibility
For some consumers, being able to use branch services depends on accessibility.
Table 4 shows percentages of branches which are wheelchair accessible, have step-free access and/or have a hearing/induction loop available for the 3 types of bank and building society branches (see note 10). The step-free access characteristic is not applicable to mobile branches (see note 11).
Of the brick-and-mortar bank and building society branches, 61.3% of type A (larger PCA providers) and 54.0% of type B (other) branches have all 3 features. Excluding the branches for which some values are unreported, these percentages become 86.4% and 70.1% respectively.
56.9% of Post Office (excluding mobile and outreach) have both wheelchair access and a hearing/induction loop. We do not have information on step-free accessibility for Post Office branches.
Table 4: Percentages of branches with common accessibility characteristics by branch type
| Wheelchair accessible | Has step-free access | Has hearing/ induction loop available | ||||||||
|---|---|---|---|---|---|---|---|---|---|---|
| Access point type | Sample | Yes | No | Unreported | Yes | No | Unreported | Yes | No | Unreported |
| A: Larger banks and building societies providing PCA (brick-and-mortar branches) | All data | 94.4 | 5.5 | - | 68.1 | 2.9 | 29.0 | 95.7 | 4.3 | - |
| Excluding unreported | 94.5 | 5.5 | x | 96.0 | 4.0 | x | 95.7 | 4.3 | x | |
| B: All other banks and building societies (brick-and-mortar branches) | All data | 78.8 | 5.6 | 15.6 | 69.5 | 7.5 | 23.0 | 65.0 | 21.0 | 14.0 |
| Excluding unreported | 93.3 | 6.7 | x | 90.3 | 9.7 | x | 75.6 | 24.4 | x | |
| C.Post Office branches (excl. mobile/outreach): accessibility |
All data | 73.4 | 26.6 | - | - | - | 100.0 | 64.8 | 35.2 | - |
| Excluding unreported | 73.4 | 26.6 | x | x | x | x | 64.8 | 35.2 | x | |
| D: Mobile bank branches | All data | 55.5 | 22.7 | 21.9 | - | 78.1 | 21.9 | 78.1 | - | 21.9 |
| Excluding unreported | 71.0 | 29.0 | x | - | 100.0 | x | 100.0 | - | x | |
| E.Mobile/outreach Post Office branches: accessibility |
All data | 1.6 | 98.4 | - | - | - | 100.0 | 1.5 | 98.5 | - |
| Excluding unreported | 1.6 | 98.4 | x | x | x | x | 1.5 | 98.5 | x | |
Table 4: Percentages of branches with common accessibility characteristics by branch type (.xlsx)
10. Mobile stops and outreach branches are typically open for a small number of hours on selected days of the week, so the overall proportions of these branches open at a given time are generally low.
11. Proportions given in the ‘excluding unreported’ rows in Table 4 are unbiased estimates of the respective true proportions where there is no connection between the non-reporting and the value of the characteristic in question. Proportions given in the ‘all data’ rows represent worst-case scenario bounds. For example, if all the 21.9% of mobile bank branches (type D) for which step-free access is unreported are, in fact, step-free accessible, the overall proportions will be 21.9% and 78.1%. If none of them is step-free accessible, the overall proportions will be 0% and 100% for yes and no respectively.
Symbols ‘x’ and ‘–’ in Table 4 denote ‘not applicable’ and ‘none’ (ie, exactly zero) respectively. In some cases, the percentages do not sum to exactly 100% because of rounding.
4. Attributions
In addition to the data collected from banks, building societies, and the Post Office, the analysis uses other open data and data licensed under the Public Sector Geospatial Agreement.
- ATM data © LINK Scheme Ltd, LINK Network Members, and licensors copyright and database right 2022.
- Contains OS data © Crown copyright and database right 2022.
- Contains NRS data © Crown copyright and database right 2022.
- Contains NISRA data © Crown copyright and database right 2021.
- Contains National Statistics data © Crown copyright and database rights 2021/2022.
- Contains Royal Mail data © Royal Mail copyright and database right 2022.
- Office for National Statistics licensed under the Open Government Licence v.3.0.
- Contains public sector information licensed under the Open Government Licence v3.0.
- This product contains data created and maintained by Scottish Local Government.