This is an overview of geographical cash access coverage in the UK at the end of the fourth quarter (October to December) of 2021.
1. Introduction
On a quarterly basis, with the Financial Conduct Authority (FCA), we gather and update data on access to cash. This captures the locations of cash access points and other relevant information like temporary closures, opening hours, and accessibility. This data covers brick-and-mortar, mobile bank, and building society branches, automated teller machines (ATMs), and the Post Office network. We supplement this information with annual data on cashback locations.
This analysis provides insights on the proportion of the population that lives within a range of distances of various cash access points. We measure distances as the crow flies (see note 1), consistent with the approaches adopted by LINK and the Post Office.
We estimate that for access to any bank, building society, Post Office branch, or any ATM (either free or pay-to-use):
- 95.7% of the UK population are currently within 2km of a cash access point
- 99.7% of the UK population are currently within 5km of a cash access point
For free-to-use access points only:
- 95.5% of the UK population are currently within 2km of a cash access point
- 99.7% of the UK population are currently within 5km of a cash access point
For the UK, estimates of coverage at 2km and 5km for all access points, including free-to use access points only, have not changed since 2021 Q2. This applies to the UK population overall, as well as rural and urban populations separately. It also applies whether we include or exclude cashback. However, there has been changes in the type of access points available over this time. Between 2021 Q3 and 2021 Q4:
- The number of brick-and-mortar branches of the larger banks and building societies providing personal current accounts (PCA) continued to fall, as 82 (1.5%) ceased to provide services. This brings the total reduction in these branches to 573 since 2021 Q1, a reduction of 9.8%.
- The share of the UK population living within 2km of a large PCA provider brick-and-mortar branch fell by 0.3 percentage points from 59.6% to 59.3%. The share living within 5km fell by 0.2 percentage points, from 87.4% to 87.2%. Coverage of such branches has consistently declined since 2021 Q1 when it was 61.8% at 2km and 88% at 5km.
- There was a small decrease in the availability of Post Office branches (1%) and number of free-to-use ATMs (<1%) between Q3 and Q4, although this had negligible impacts on overall cash access coverage.
Our analysis of other access characteristics finds that:
- Temporary closures in 2021 Q4 were much more common than in 2021 Q3 for both Type A (brick-and-mortar branches of a larger PCA provider) and Type B (brick-and-mortar bank and building society branches offering limited deposit and withdrawal services). For branches that had temporary closures of 1 day or more, the typical (median) length of closure remained the same for Type A branches (2 days) but fell for Type B branches (1 day).
- In 2021 Q4 average opening hours for branches (bank and building society brick-and-mortar) remained broadly unchanged at around 35 hours a week. However, around 91.5% of these branches were operating on reduced opening hours compared to February 2020 (up from 86% in Q3).
- Of brick-and-mortar bank and building society branches, 63.2% of larger PCA providers and 51.3% of other branches reported that they are wheelchair accessible, have step-free access and have a hearing/induction loop, a 1 percentage point increase for the former and a 3 percentage point decrease for the latter when compared to 2021 Q3. 86.7% of Post Office branches (excluding mobile and outreach branches) have both wheelchair access and a hearing/induction loop, an increase of 8percentage points from 2021 Q3.
2. Coverage
The data comprises 71,727 known UK cash access points and 429,482 cashback locations. Table 1 shows numbers by region for 8 types of access points (see notes 2, 3, and 4):
- Types A and B are brick-and-mortar bank and building society branches provided by (A) larger PCA providers and (B) all other banks and building societies, respectively.
Type B branches may offer more limited deposit and withdrawal services compared to Type A branches, for example, a building society that specialises in mortgages or savings accounts. - Mobile bank branches (measured by stops) are a separate type (D).
- Post Office branches are subdivided into mobile / outreach branches (type E) and all other Post Office branches (type C). The outreach branches are brick-and-mortar but are more similar to mobile branches being typically open for a small number of hours or on selected days of the week. For example, these include limited time to serve access points in community buildings in rural locations. For this reason, we group the mobile and outreach branches together.
- ATMs are subdivided into free-to-use (type F) and pay-to-use (type G).
- Cashback locations (type H) are all the unique locations where a cashback transaction is known to have taken place in 2020.
Table 1: Number of cash access points by type and region (XSLX)
We have analysed coverage for 14 groups of cash access points which we define in Table 2. The groups are constructed by combining the cash access point types and cashback locations:
- group 1 includes type A (larger banks and building societies providing PCA) access points only
- group 2 adds the non-mobile/outreach Post Office network
- group 3 includes all brick-and-mortar (except type B) and mobile/outreach bank, building society, and Post Office branches, representing all known locations where customers can access banking services beyond cash withdrawals or deposits
- groups 4 and 5 include the same cash access point types as Group 3, as well as all free-to-use ATMs and all ATMs respectively
- group 6 includes type B branches and contains all free-to-use access points.
- group 7 includes all 71,727 known cash access points
- groups 8 and 9 focus on access to ATMs, for free-to-use and all ATMs respectively
- groups 10, 11, and 12 combine free-to-use access points, all access points and all ATMs respectively with cashback locations
- groups 13 and 14 focus on access to the Post Office network distinguishing between non-mobile/outreach branches and all branches
Due to substitutability, as outlined above, type B branches are only included in groups 6, 7, 10, and 11.
Table 2: Groupings of cash access points (XLSX)
Estimated percentages of the UK population living within a given distance from a cash access point are shown in Table 3 (see notes 5, 6, and 7). The estimates are given for the UK regions separately, as well as for England and the UK overall. Estimates for rural and urban areas are also given (see note 8).
The distances considered are 1, 2, 5, 8, and 16 km (approximately 0.6, 1.2, 3, 5, and 10 miles, respectively).
Figure 1 shows the coverage areas underlying the population estimates in Table 3. As in Table 3, the cash access points considered are those in groups 1-14. In each case the areas shown are those without access to a source of cash within 1, 2, 5, 8, or 16 km. The areas shown in white have a cash access point within 1 km or nearer. The interactive tooltips show percentages of the Local Authority District population that have access to a source of cash within the above range of distances.
Download underlying data for Figure 1 maps (XLSX)
Figure 1: Access to cash coverage in the UK in 2021 Q4
3. Other insights
3.1. Temporary closures
About 34% of type A (larger PCA providers) and 15% of type B (other) bank and building society branches were temporarily closed for at least 1 day during 2021 Q4 due to coronavirus (Covid-19) and other reasons. Of branches which had temporary closures of at least 1 day, a typical (median) branch of type A or B was closed for 2 and 1 days respectively, with the average number of temporary closure days across type A and B branches being 5 and 3 days respectively.
Temporary closures of mobile branches (type D) have been less common than for physical branches. Since 2021 Q3 there has been a decrease in the level of temporary closures, but increase in the length. During 2021 Q4 about 56% of mobile branches were temporarily closed. The average and median number of temporary closure days were 3 and respectively for those branches that have been closed for 1 day or more.
We do not have equivalent information for Post Office branches.
3.2. Opening hours
While external and stand-alone ATMs are always accessible, in-branch cash withdrawals and deposits and other banking services are only available during branch opening hours.
At the end of 2021 Q4, 91.5% of type A and of type B bank and building society branches were operating on reduced hours compared to the normal opening hours (in February 2020) before the first lockdown.
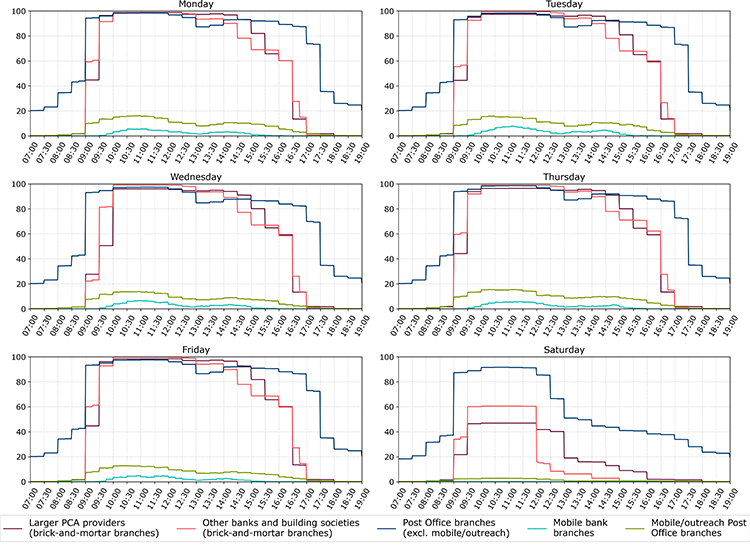
Figure 2 shows the percentages of branches open at a given time between 7am and 7pm, Monday to Saturday (see note 10), by branch types defined in Table 1. This illustrates a substantial increase in opening hours since 2021 Q1. For example, around of type A (larger PCA providers) branches remain open after 2pm Monday to Friday, and over 82% (9% in Q1) after 3pm. On average, type A and B branches are open 35 hours per week. There were no changes in average opening hours of Post Office branches from 2021 Q3 to 2021 Q4.
Figure 2: Percentages of branches open at a given time by branch type
3.3. Accessibility
For some consumers, being able to use branch services depends on accessibility features.
Table 4 shows percentages of branches which are wheelchair accessible, have step-free access and/or have a hearing/induction loop available for the 3 types of bank and building society branches (see note 9) as well as Post Office branches. The step-free access characteristic is not applicable to mobile branches (see note 10).
Of the brick-and-mortar bank and building society branches, 63.2% of type A (larger PCA providers) and 51.3% of type B (other) branches have all 3 characteristics. Excluding the branches for which some values are unreported, these percentages become 88.3% and 70.1% respectively. 86.8% of Post Office (excluding mobile and outreach) branches have both wheelchair and a hearing/induction loop. This increases to 100% if we exclude branches for which some values are unreported. We do not have information on step-free accessibility for Post Office branches.
Table 4: Percentages of branches with common accessibility characteristics by branch type (XLSX)
Notes
- Relative to analogous travel distance, the approach based on straight line distances is likely to overestimate coverage and underestimate the areas with no coverage. The effect is likely to be more important for longer, non-walkable distances. All computations are performed in the British National Grid (OSGB 1936) projection.
- The counts in Table 1 are for all known access points. The number of unique locations offering access will be smaller because, for example, a typical branch will have one or more internal and/or one or more external ATMs, and these are counted separately. This does not apply to cashback vendor locations as only unique locations are counted (see also note 4). There are no mobile bank branches or mobile/ outreach Post Office branches in London.
- Cashback locations are the unique locations of vendors which are known to have offered cashback at some point in 2020 to customers using either a Mastercard or a Visa card. There could be other merchants offering cashback not included in this dataset, either because no transaction involving cashback took place or because such transactions did not involve Visa or Mastercard.
- While we have made every effort to ensure the dataset is complete and up to date, there may still be some omissions or other discrepancies. This dataset does not include ATMs that were temporarily closed due to Covid-19 restrictions at the time the data was collected. Data on some smaller banking companies may be missing, and not all recent branch closures, openings or other changes may have been reflected. Of the Post Office branches, we included only those classified by the Post Office as active at the time the data was collected.
- All population estimates are based on 2011 census output area (OA) geographies (small areas in Northern Ireland), mid-2020 estimates of the usual resident population for OAs in England, Northern Ireland, and Wales, and for Data Zones in Scotland. Population estimates for OAs in Scotland are obtained by proportionally adjusting the 2011 census estimates using the aggregate mid-2020 population estimates for Data Zones. We compute the population estimates for arbitrary areas based on the assumption that population density is uniform over each OA. For ease of reference, columns ‘Population, 000’s’ in Table 3 reproduce these population estimates (in thousands) for all included areas.
- While we have made every effort to get precise locations of all access points, some locations are precise to their respective postcode centroids only. In most cases the locations used in this analysis are those supplied by banks, building societies, the Post Office, the LINK Scheme Ltd, Visa, and Mastercard.
- All estimates in Table 3 are reported to 1 decimal place precision. For some groups the estimates are very similar or nearly identical, for example those for groups 7 (all cash access points) and 5 (all except type B). This is because many cash access points, particularly bank and building society branches, tend to cluster around settlement centres.
- The definitions used for rural-urban classification differ between England and Wales, Scotland and Northern Ireland. In the case of Northern Ireland, for simplicity, we have reallocated the 165 out of 4,537 small areas originally assigned to a mixed rural/urban category to either rural or urban category based on their band. We have allocated bands A-E as urban and F-H as rural; see NISRA Urban-Rural Classification 2015 for more details.
- Some Post Office branches are also open before 7am and/or after 7pm, and some are also open on Sundays – these are not shown in Figure 2. Mobile stops and outreach branches are typically open for a small number of hours on selected days of the week, so the overall proportions of these branches open at a given time are generally low.
- Proportions given in the ‘excluding unreported’ rows in Table 4 are unbiased estimates of the respective true proportions where there is no connection between the non-reporting and the value of the characteristic in question. Proportions given in the ‘all data’ rows represent worst-case scenario bounds. For example, if all the 1% of non-mobile/outreach (type C) Post Office branches for which wheelchair accessibility is unreported are, in fact, wheelchair accessible, the overall proportions will be 100% and 0%, whereas if none of them are wheelchair accessible, the overall proportions will be 88.9% and 11.1% for yes and no respectively.
Symbols ‘x’ and ‘–’ in Table 4 denote ‘not applicable’ and ‘none’ (ie, exactly zero) respectively.
4. Attributions
In addition to the data collected from banks, building societies, and the Post Office, the analysis uses other open data and data licensed under the Public Sector Geospatial Agreement.
- ATM data © LINK Scheme Ltd, LINK Network Members, and licensors copyright and database right 2021.
- Contains OS data © Crown copyright and database right 2021.
- Contains NRS data © Crown copyright and database right 2021.
- Contains National Statistics data © Crown copyright and database rights 2021.
- Contains Royal Mail data © Royal Mail copyright and database right 2021.
- Office for National Statistics licensed under the Open Government Licence v.3.0.
- Contains public sector information licensed under the Open Government Licence v3.0.
- This product contains data created and maintained by Scottish Local Government.