Authorised push payment (APP) scams happen when a scammer tricks someone into sending a payment to an account outside of their control. APP scams remain a huge source of concern with millions of pounds being lost each year and a devastating impact left on victims.
In a significant step towards greater transparency, the PSR publishes annual data on payment firms’ APP scam performance. This data covers:
- Reimbursement to victims (from the largest 14 banking groups in Great Britain and Northern Ireland)
- How much money is sent from victims’ accounts by each payment firm as a result of APP scams (from the largest 14 banking groups in Great Britain and Northern Ireland)
- How much money is received into fraudsters’ accounts by each payment firm as a result of APP scams (covering scams sent from accounts held with the 14 largest banking groups in Great Britain and Northern Ireland to any UK payment firm)
The PSR’s latest report covering 1 January 2024 - 6 October 2024 includes the UK’s 14 largest banking groups, along with the data for eleven other smaller firms that were in the top 20 highest receivers of fraud. The smaller firms are included as they represent a disproportionately high level of fraud received.
With this data, you will be able to see the full extent of how well your bank has performed in tackling APP fraud and how they treated victims in the last year, compared to other UK banks and payment firms.
On this page you’ll find this comparison data for 1 January 2024 - 6 October 2024, as well as the full downloadable reports for 2023 and 2022.
To ensure more consistent consumer protections are in place, our mandatory reimbursement requirements for victims of APP scams came into force on 7 October 2024.
The UK’s payment firms have also seen additional interventions from the PSR to improve data sharing to spot and prevent scams, and the roll-out of the name-checking service, Confirmation of Payee.
-

APP Fraud Performance Report Covering 2024
pdf | 1.2 MB
-

APP Fraud Performance Report Covering 2023
pdf | 1 MB
-

APP Fraud Performance Report Covering 2022
pdf | 929 KB
View an accessible version of this page with the data in a text and table format.
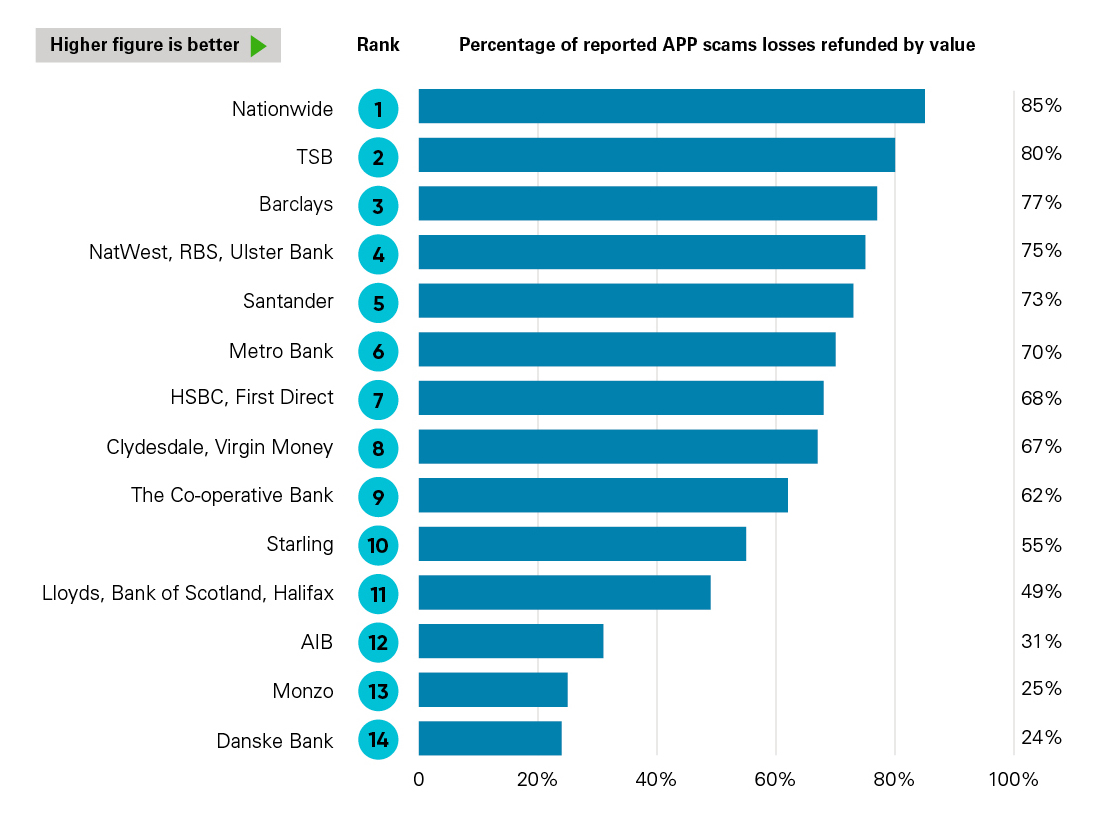
Metric A: Percentage of reported APP scams losses refunded by value until 7 October 2024
The data in this chart is for the period prior to the introduction of the reimbursement requirement. It shows the percentage of APP scam losses reimbursed by the 14 largest banking groups for transactions before 7 October 2024 (cases closed in 2024). For example, Nationwide refunded 85% of the total value of money its customers lost to APP scams in 2024.
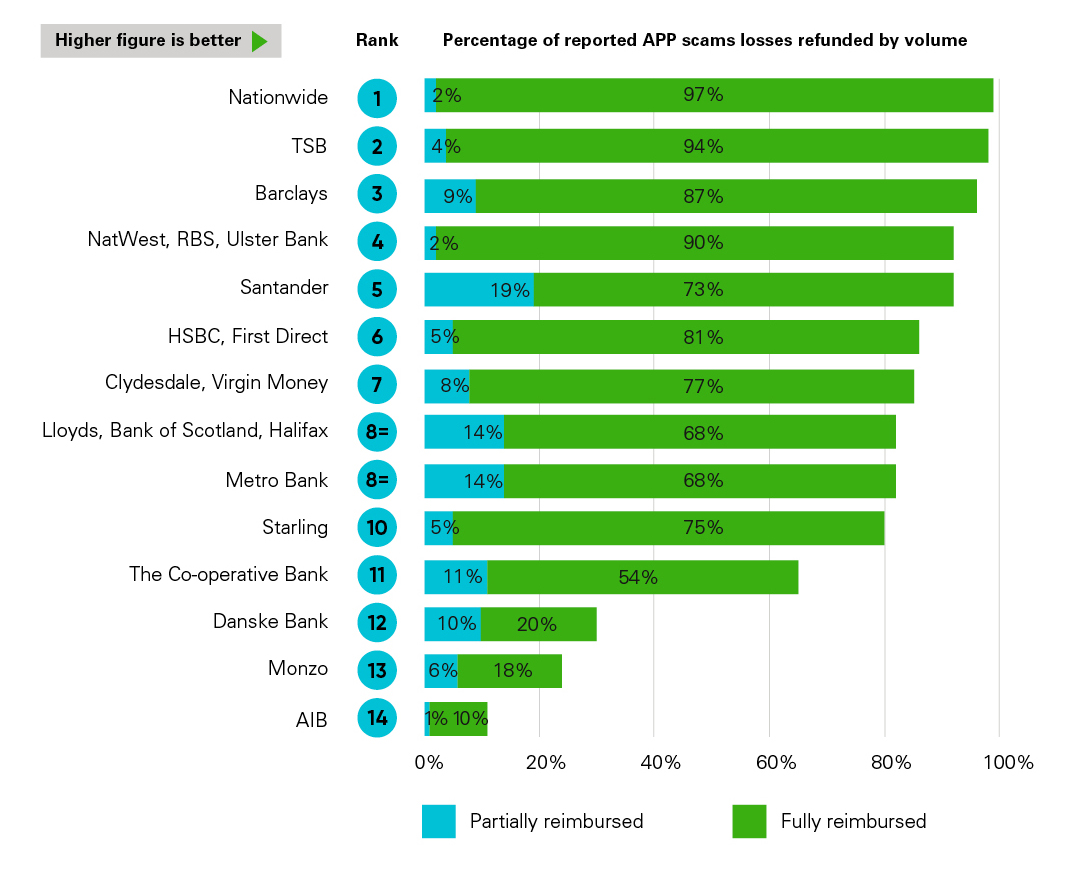
Metric A: Percentage of reported APP scams losses refunded by volume until 7 October 2024
The data in this chart is for the period prior to the introduction of the reimbursement requirement. It shows the percentage of APP scam cases that were fully and partially reimbursed by the 14 largest banking groups
in the UK before 7 October (cases closed in 2024). For example, Nationwide fully reimbursed 97% and partially reimbursed 2%.
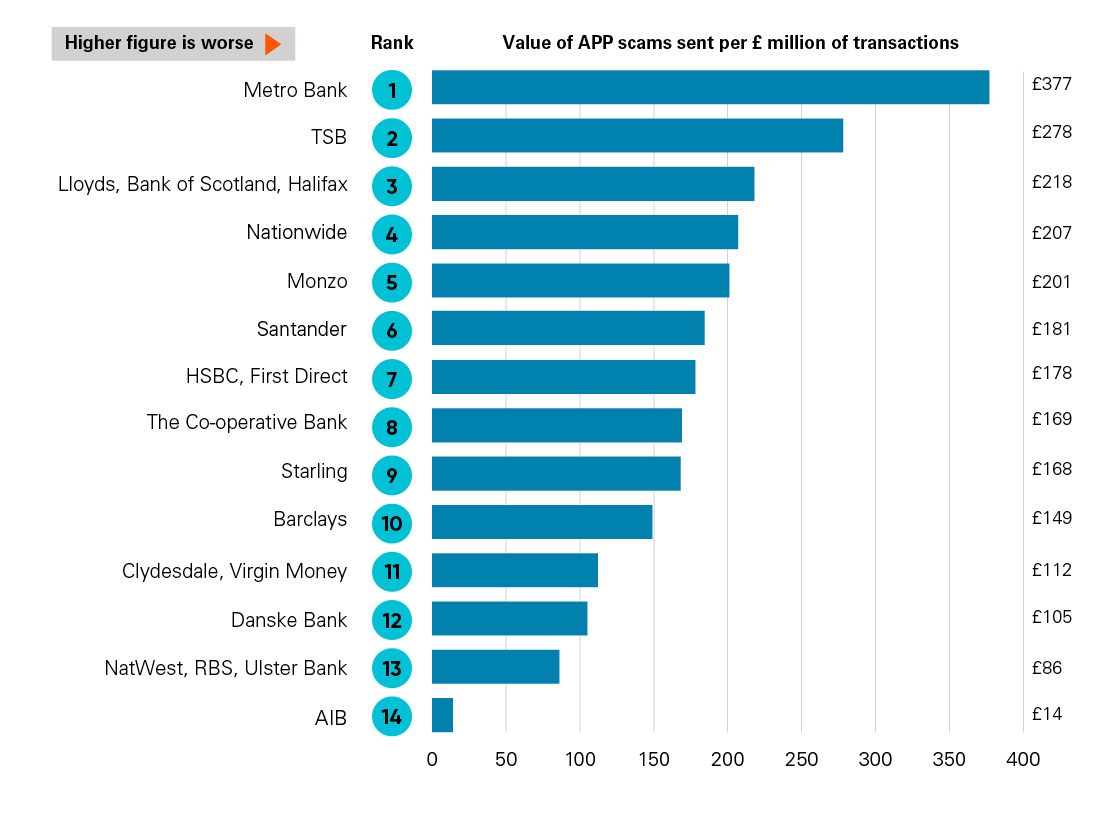
Metric B: Value of APP scams sent per £ million of transactions until 7 October 2024
The data in this chart is for the period prior to the introduction of the reimbursement requirement. It shows how much money customers at the 14 largest banking groups lost to APP scams for every £ million of transactions sent before 7 October 2024. For example, for every £1 million of transactions sent by customers of Metro Bank, £377 was lost to APP scams.
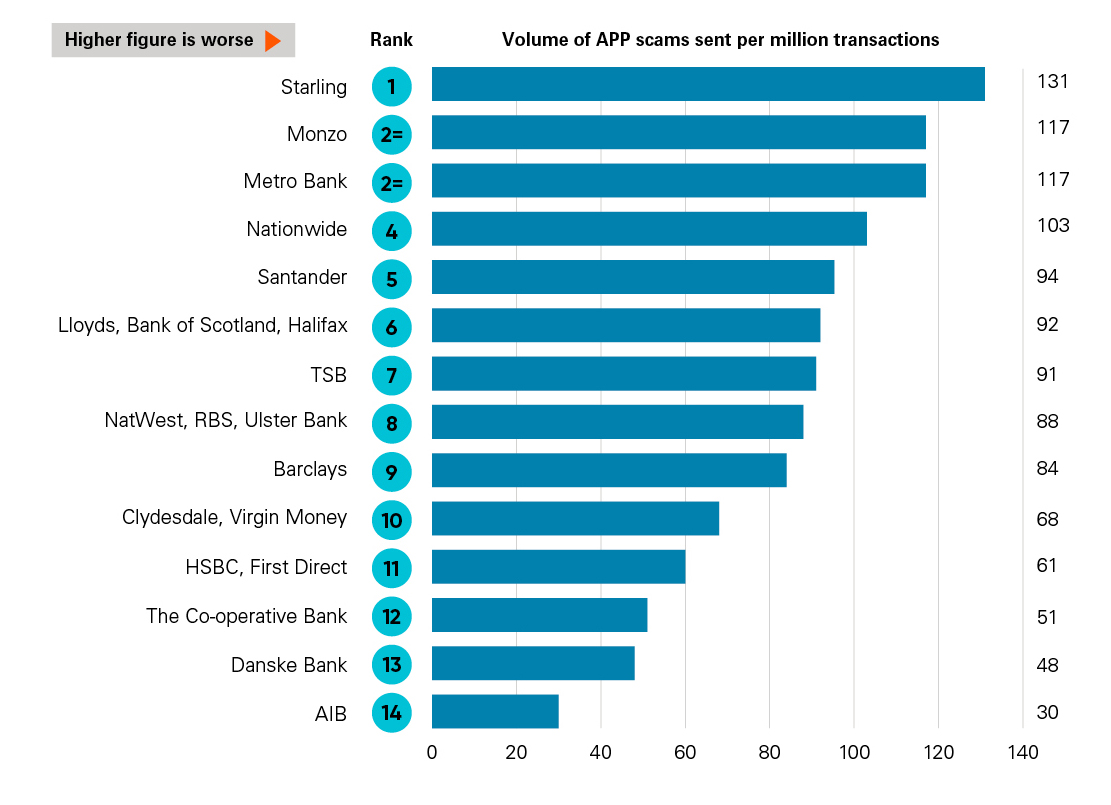
Metric B: Volume of APP scams sent per million transactions until 7 October 2024
The data in this chart is for the period prior to the introduction of the reimbursement requirement. It shows the number of APP scam transactions per million transactions customers of the 14 largest banking groups sent prior to 7 October 2024. For example, for every 1 million customer transactions Starling sent, 131 were reported as APP scams payments.
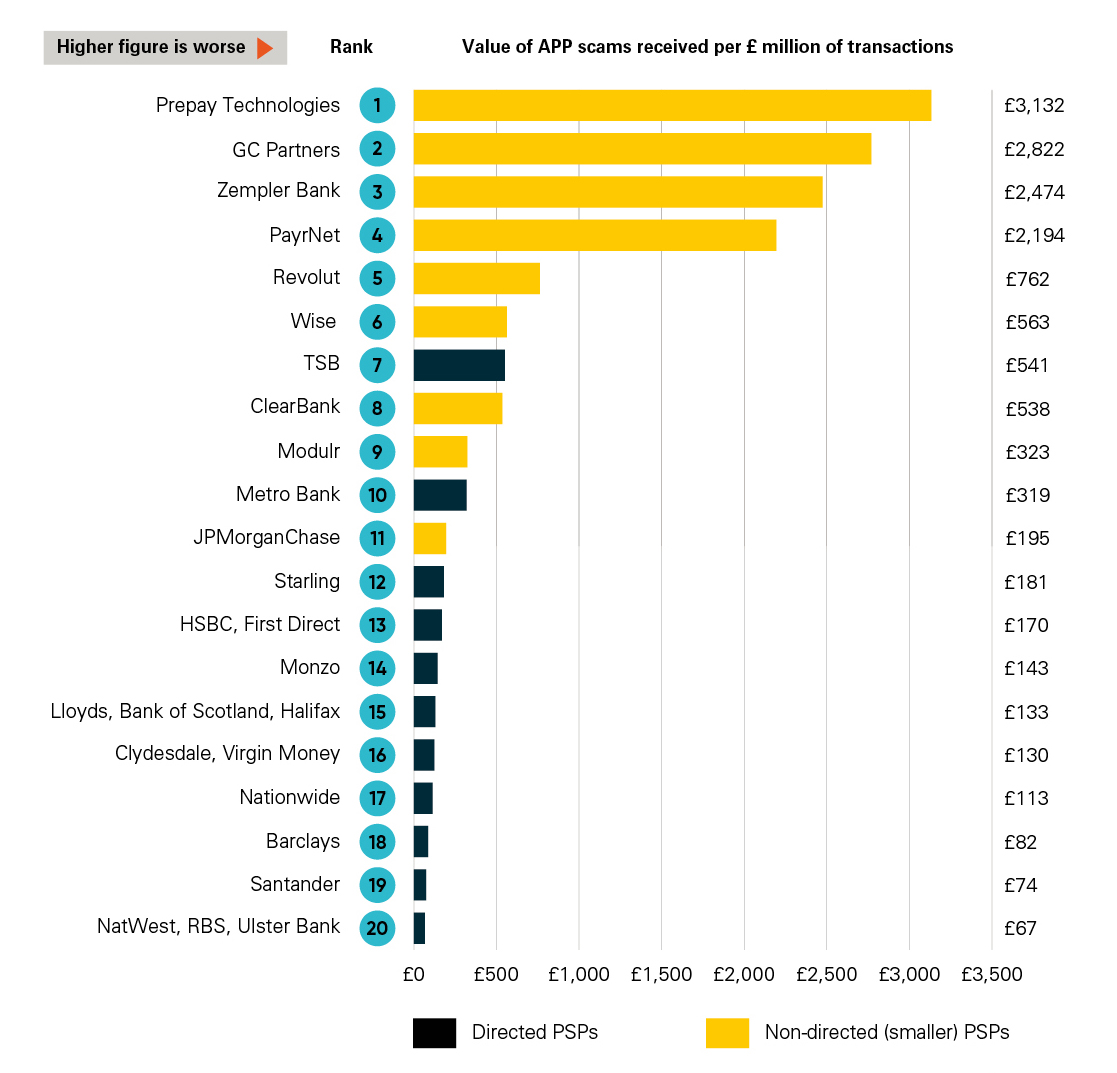
Metric C: Value of APP scams received per £ million of transactions until 7 October 2024
The data in this chart is for the period prior to the introduction of the reimbursement requirement. It shows the 20 firms which received the highest value of APP scams per £ million of transactions
received prior to 7 October 2024.
For example, for every £1 million received into customer accounts at Prepay Technologies, £3,132 was APP scams.
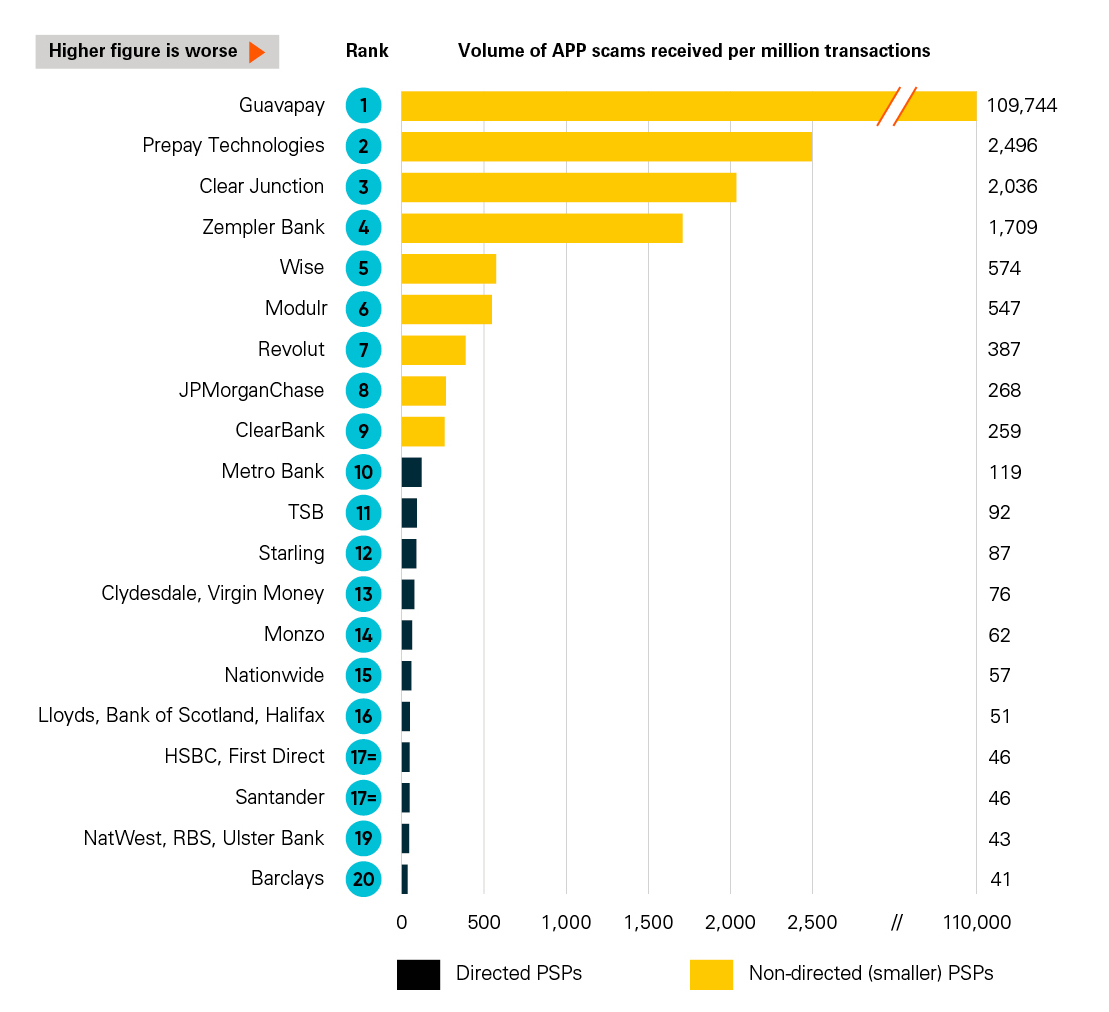
Metric C: Volume of APP scams received per million of transactions until 7 October 2024
The data in this chart is for the period prior to the introduction of the reimbursement requirement. It shows the 20 firms which received the highest value of APP scams per million transactions
received prior to 7 October 2024.
For example, for every 1 million transactions received by customers of Guavapay, 109,744* were APP scam payments.
- For comparison purposes, data for Guavapay has been scaled to represent fraudulent transactions per million transactions. The total number of fraudulent transactions received by Guavapay is much smaller (fewer than 10,000).