Following our Q1 2021 (January - March) update on access to cash, the PSR and FCA have today (09 November 2021) published the access to cash coverage update Q2 2021 (April - June).
This publication provides a broad overview of the UK’s access to cash infrastructure, including bank, building society, Post Office branches, ATMs and cashback (see 1 below). It is the second in a series of regular updates that will monitor cash access coverage over time, and will inform our ongoing work, including:
- the FCA’s supervision guidance on branch and ATM closures or conversions,
- legislative work with the Government, and
- our engagement with the industry on cash access issues.
Below we provide some key insights focusing on access to cash coverage (see 2 below), free access to cash coverage (see 3 below) and ATM coverage (see 4 below). More detail on this update and other statistics such as bank and building society branch coverage, accessibility and opening times can be found in the full publication on the FCA website.
Summary of key insights
This is an overview of geographical cash access coverage in the UK at the end of Q2 2021.
The maps produced illustrate that, across the UK, 88.8% of the population currently has access to cash within a 1km radius of where they live. This is a 0.1 percentage point increase when compared to Q1. When considering only free access to cash, the analysis shows that 87.5% of the UK population has free access to cash within 1km of where they live. This is a 0.1 percentage point increase when compared to Q1.
Comparisons between rural and urban areas across the UK show that, of those living in urban areas, 96.7% of the population have access to cash within 1km, whilst 55% of those living in rural areas have access to cash within 1km. This represents a 0.1 and 0.3 percentage point increase respectively when compared to Q1.
Overall, we have seen a small percentage increase in access to cash at distances of 1km and 2km. Access has remained similar at 5km distances.
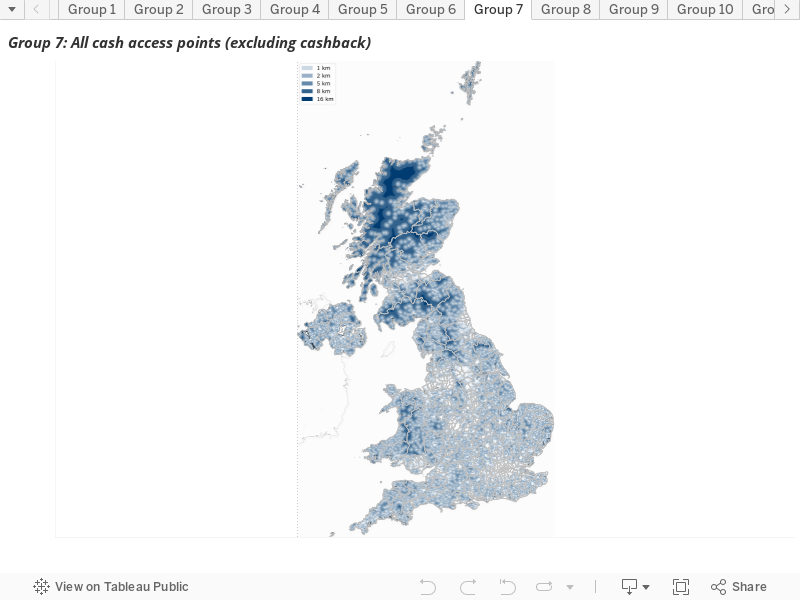
Coverage of free and paid-for access to cash
Based on access via the following channels – free or pay-to-use ATMs, bank, building society, and Post Office Branches – compared to where they live, we estimate:
- 88.8% of the UK population is currently within 1km of access to cash
- 95.7% of the UK population is currently within 2km of access to cash
- 99.7% of the UK population is currently within 5km of access to cash
To note:
- This quarter we have supplemented this information with data on cashback vendor locations.
- Brick-and-mortar and mobile bank and building society branches, free and charging ATMs, and the Post Office network
- Brick-and-mortar and mobile bank and building society branches, free ATMs, and the Post Office network
- Free and charging ATMs
Areas of the UK with access to cash within [1, 2, 5, 8, and 16 km]
In urban areas, we estimate:
- 96.7% of the UK population is currently within 1km of access to cash
- 99.8% of the UK population is currently within 2km of access to cash
- 100% of the UK population is currently within 5km of access to cash
In rural areas, we estimate:
- 55% of the UK population is currently within 1km of access to cash
- 78.3% of the UK population is currently within 2km of access to cash
- 98.4% of the UK population is currently within 5km of access to cash
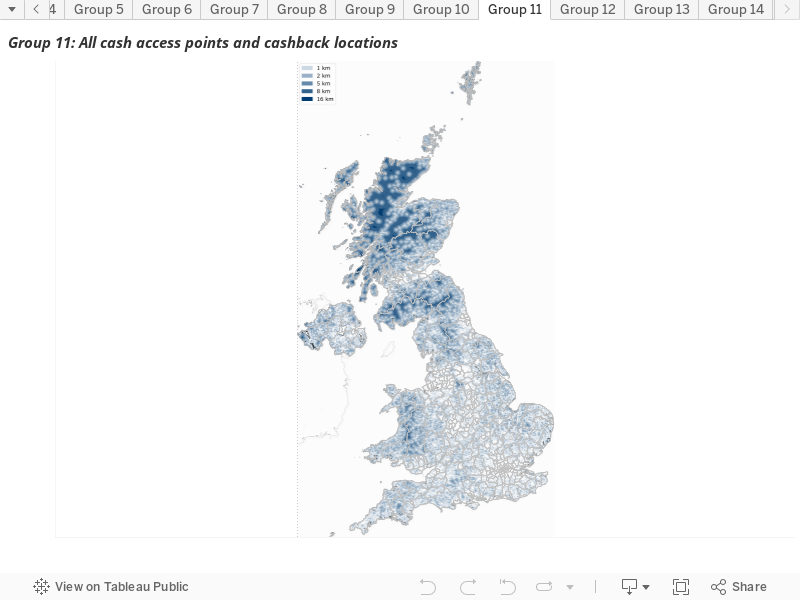
Coverage of free and paid-for access to cash including cashback (see 6 below)
Based on access via the following channels – free or pay-to-use ATMs, bank, building society, Post Office Branches and cashback – compared to where they live, we estimate:
- 95.7% of the UK population is currently within 1km of access to cash
- 99% of the UK population is currently within 2km of access to cash
- 99.9% of the UK population is currently within 5km of access to cash
Areas of the UK with access to cash including cashback within [1, 2, 5, 8, and 16 km]
To note:
6. This takes into account unique locations where a cashback transaction is known to have taken place in 2020.
In urban areas, we estimate:
- 99.6% of the UK population is currently within 1km of access to cash
- 100% of the UK population is currently within 2km of access to cash
- 100% of the UK population is currently within 5km of access to cash
In rural areas, we estimate:
- 78.9% of the UK population is currently within 1km of access to cash
- 94.7% of the UK population is currently within 2km of access to cash
- 99.6% of the UK population is currently within 5km of access to cash
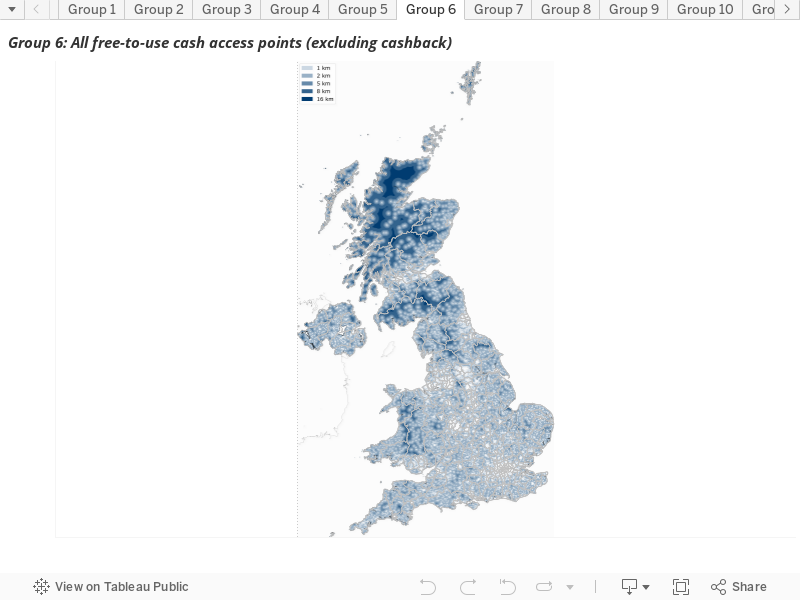
Coverage of free access to cash
Based on access via the following free-to-use channels – free ATMs, bank, building society, and Post Office Branches – compared to where they live, we estimate:
- 87.5% of the UK population is currently within 1km of free access to cash
- 95.5% of the UK population is currently within 2km of free access to cash
- 99.7% of the UK population is currently within 5km of free access to cash
Areas of the UK with free access to cash within [1, 2, 5, 8, and 16 km]
In urban areas we estimate:
- 95.4% of the UK population is currently within 1km of free access to cash
- 99.7% of the UK population is currently within 2km of free access to cash
- 100% of the UK population is currently within 5km of free access to cash
In rural areas we estimate:
- 53.5% of the UK population is currently within 1km of free access to cash
- 77.3% of the UK population is currently within 2km of free access to cash
- 98.3% of the UK population is currently within 5km of free access to cash
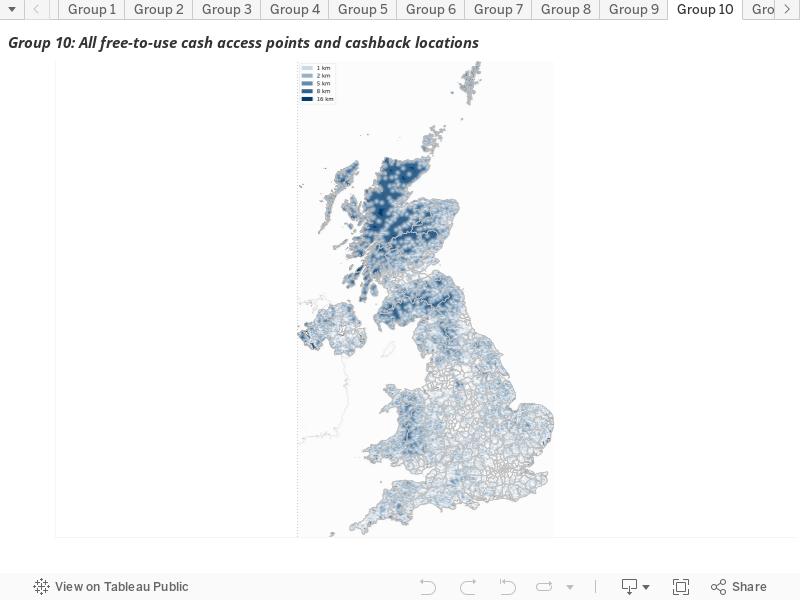
Coverage of free access to cash including cashback
Based on access via the following free-to-use channels – free ATMs, bank, building society, Post Office Branches and cashback – compared to where they live, we estimate:
- 95.7% of the UK population is currently within 1km of free access to cash
- 99% of the UK population is currently within 2km of free access to cash
- 99.9% of the UK population is currently within 5km of free access to cash
In urban areas, we estimate:
- 99.6% of the UK population is currently within 1km of access to cash
- 100% of the UK population is currently within 2km of access to cash
- 100% of the UK population is currently within 5km of access to cash
In rural areas, we estimate:
- 78.9% of the UK population is currently within 1km of access to cash
- 94.7% of the UK population is currently within 2km of access to cash
- 99.6% of the UK population is currently within 5km of access to cash
Areas of the UK with free access to cash including cashback within [1, 2, 5, 8, and 16 km]
ATM Coverage
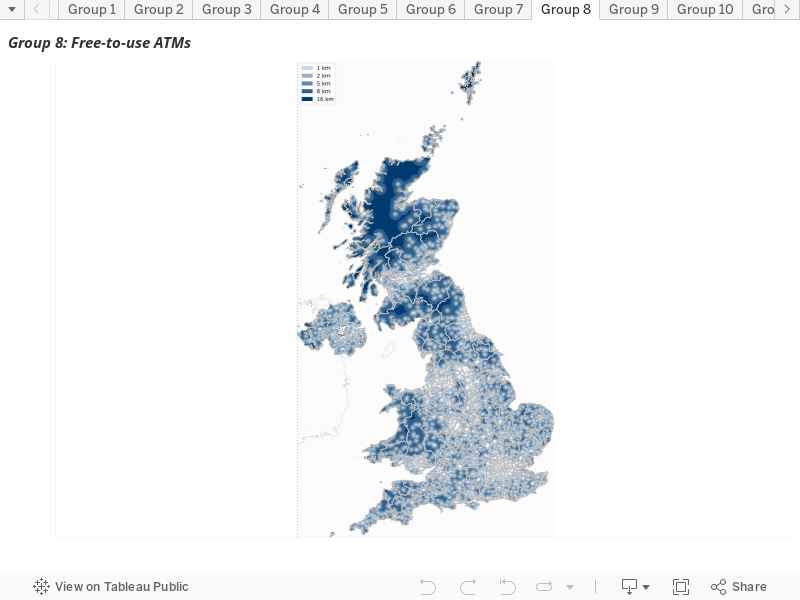
Free-to use ATM Coverage
Based on access via free ATMs we estimate:
- 82.8% of the UK population is currently within 1km of a free-to-use ATM
- 91.3% of the UK population is currently within 2km of a free-to-use ATM
- 97.7% of the UK population is currently within 5km of a free-to-use ATM
Areas of the UK that have access to a free to use ATM within [1, 2, 5, 8, and 16 km]
In urban areas we estimate:
- 93.3% of the UK population is currently within 1km of a free-to-use ATM
- 99.4% of the UK population is currently within 2km of a free-to-use ATM
- 100% of the UK population is currently within 5km of a free-to-use ATM
In rural areas we estimate:
- 37.8% of the UK population is currently within 1km of a free-to-use ATM
- 56.7% of the UK population is currently within 2km of a free-to-use ATM
- 87.9% of the UK population is currently within 5km of a free-to-use ATM
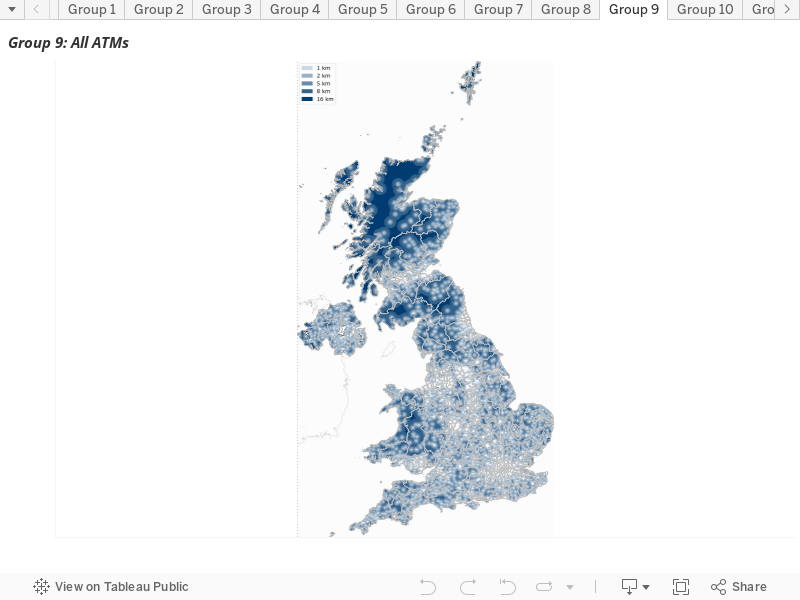
Free and Pay-to-use ATM Coverage
Based on access via both free and pay-to-use ATMs we estimate:
- 85.7% of the UK population is currently within 1km of an ATM
- 92.5% of the UK population is currently within 2km of an ATM
- 98.3% of the UK population is currently within 5km of an ATM
Areas of the UK that have access to an ATM within [1, 2, 5, 8, and 16 km]
In urban areas we estimate:
- 95.7% of the UK population is currently within 1km of an ATM
- 99.6% of the UK population is currently within 2km of an ATM
- 100% of the UK population is currently within 5km of an ATM
In rural areas we estimate:
- 42.6% of the UK population is currently within 1km of an ATM
- 61.8% of the UK population is currently within 2km of an ATM
- 90.8% of the UK population is currently within 5km of an ATM
Next steps
The PSR and FCA have been actively monitoring access to cash in the UK for some time and both regulators have set out expectations of firms and industry in May 2021. The PSR’s priority remains on access to the ATM network, to ensure the UK’s cash system remains sustainable and resilient and continues to provide access to those who need it.
In October, we published a consultation paper on the PSR’s new Specific Direction that is set to replace Specific Direction 8, which will expire on 2nd January 2022.
We continue to engage closely with and monitor progress of the industry’s Access to Cash Action Group.
We will continue to work with the Government as it develops its legislation. We welcome the Government’s proposals giving the FCA “overall responsibility for setting requirements to ensure that the retail distribution of cash meets the needs of consumers and SMEs”. We will continue to exercise our existing powers in overseeing LINK (7) to support the delivery of cash access for consumers and SMEs.
To note:
7. We have used our powers to issue a Specific Direction that holds LINK to its Commitments on Free-To-Use ATMs. We continue to monitor LINK’s progress through engagement, information requests and reviews of specific directions
How we have planned our maps
Relative to analogous travel distance, the approach based on straight line distances is likely to overestimate coverage (underestimate the areas with no coverage). The effect is likely to be more important for longer, non-walkable distances. All computations are performed in the British National Grid (OSGB 1936) projection.
Cashback locations are the unique locations of vendors which are known to have offered cashback at some point in 2020 to customers using either a Mastercard or a Visa card. There could be other merchants offering cashback not included in this dataset, either because no transaction involving cashback took place or because such transactions did not involve Visa or Mastercard.
While we have made every effort to ensure the dataset is complete and up to date, some omissions or other discrepancies may remain. This dataset does not include ATMs that were temporarily closed due to Covid-19 restrictions at the time the data was collected.
Data on some smaller banking companies may be missing, and not all recent branch closures, openings or other changes may have been reflected. Of the Post Office branches, we included only those classified by the Post Office as active at the time the data was collected.
All population estimates are based on 2011 census output area (OA) geographies (small areas in Northern Ireland), mid-2019 estimates of the usual resident population for OAs in England, Northern Ireland, and Wales, and for Data Zones in Scotland. Population estimates for OAs in Scotland are obtained by proportionally adjusting the 2011 census estimates using the aggregate mid-2019 population estimates for Data Zones. Population estimates for arbitrary areas are computed based on the assumption that population density is uniform over each OA. For ease of reference, columns ‘Population, 000’s’ in Table 3 reproduce these population estimates (in thousands) for all included areas.
While we have made every effort to get precise locations of all access points, some locations are precise to their respective postcode centroids only. In most cases the locations used in this analysis are those supplied by banks, building societies, the Post Office, the LINK Scheme Ltd., Visa, and Mastercard.
The definitions used for rural-urban classification differ between England and Wales, Scotland, and Northern Ireland. In the case of Northern Ireland, for simplicity, the 165 out of 4,537 small areas originally assigned to a mixed rural/urban category have been reallocated to either rural or urban category based on their band, with bands A-E allocated as urban and F-H as rural; see NISRA Urban-Rural Classification 2015 for more details.
